EnvironmentClimate Change Mitigation
1. Philosophy
Environmental problems attributable to global warming (e.g., forest fires, droughts, water shortages, rising sea levels, threats of extinction, and impacts on ecosystems) are occurring on a global scale. Such problems are also seen in Japan. They are represented by floods caused by torrential rains, health problems such as heatstroke that result from more and more days of extreme heat, and impacts on ecosystems, such as coral bleaching.
The JSR Group recognizes this as an important issue. Therefore, with the aim of helping realize a low-carbon society, we strive to lower our GHG emissions by, for example, reducing the amount of energy needed in the various processes of producing and supplying our products.
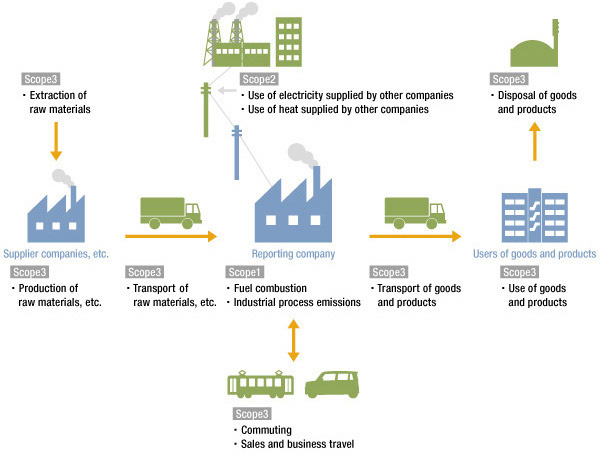
In recent years, there has been a global trend whereby businesses are managing GHGs (Scope 3) indirectly emitted from their supply chains and disclosing their emissions. The JSR Group also calculates and ascertains its emissions based on the Basic Guidelines on Accounting for Greenhouse Gas Emissions Throughout the Supply Chain issued by Ministry of the Environment, Government of Japan.
- Scope 1:
- Direct GHG emissions by sources owned or managed by a company or household (use of fuel: factory, heater, private automobile, etc.)
- Scope 2:
- Indirect GHG emissions from the use of electricity, steam, or heat (use of purchased electricity, etc.)
- Scope 3:
- Other indirect emissions besides Scope 2.
("Company" includes the procurement of raw materials, employee business trips, subcontracting of waste disposal, etc.
"Household" includes the purchase of products, travel, subcontracting of waste disposal, etc.)
2. Initiatives to Reduce Greenhouse Gas (GHG) Emissions
(1) JSR
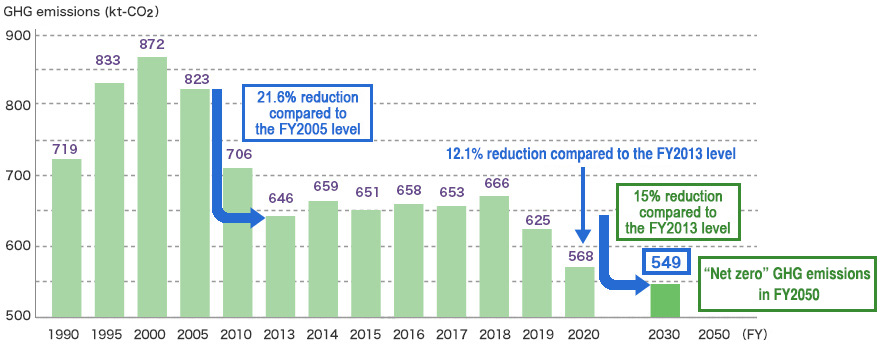
Since FY2005, we have been striving to upgrade our energy-saving technologies through various approaches, including installing fuel conversion at the Kashima Plant (South Kashima Power Plant, Inc.) and introducing cogeneration facilities and a sludge dryer system at the Yokkaichi Plant. We thus achieved a significant GHG emissions reduction of 21.6% by FY2013 compared to the FY2005 level.
For this reason, in FY2019, we set a long-term goal of “reducing emissions by 15% in FY2030 compared to the FY2013 level.” We are endeavoring to further reduce GHG emissions by introducing highly efficient equipment and using renewable energy in addition to our energy consideration activities.
In FY2020, our emissions fell by 12.1% compared to the FY2013 level, due to energy-saving activities as well a decrease in the volume of production.
As a response to TCFD, we are continuing to identify risks and opportunities with respect to climate change through scenario analyses and formulating medium- and long-term responses.
GHG emissions (kt-CO2)
Using natural gas as fuel
Reduces CO2 emissions as compared to coal- or heavy oil-fired steam boilers and condensing steam turbine systems.
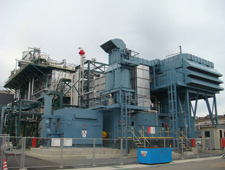
Natural gas-fired turbine cogeneration system (Yokkaichi Plant)
Reduces the amount of combustion support fuel (heavy oil) used in onsite incineration by drying high-water-content sludge that is produced by comprehensive wastewater treatment facilities and using it as fuel.
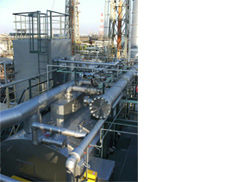
Sludge dryer system (Yokkaichi Plant)
(2) Head Office
The Tokyo Metropolitan Government requires major tenants of a building occupying a floor area of at least 5,000 square meters or consuming at least six million kWh of electricity annually to reduce its CO2 emissions under the Tokyo Metropolitan Ordinance on Environmental Preservation.
Although we are not subject to this obligation, we are promoting energy conservation on our own initiative by voluntarily setting a specific power-saving target.
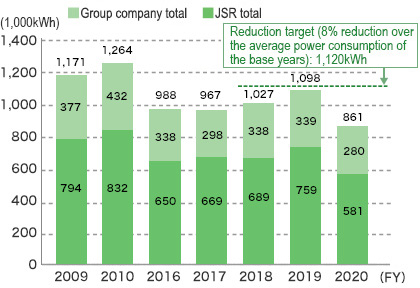
In FY2020, our power consumption fell below the base year average as a result of implementing working-from-home, in addition to the main initiatives described below, and we achieved a 23.4% reduction in our emissions compared to the base year average.
Power-Saving Target
8% reduction compared to the average power consumption from the base years of FY2009 and FY2010
Major Efforts
- Policy of turning off lights and office equipment such as printers when not in use.
- Maintaining a proper air-conditioned room temperature that achieves a balance between energy-saving and operational efficiency.
Power Consumption at the Head Office
(3) Logistics: Improving Transport Efficiency
As part of our environmental efforts in transportation, we have taken steps to reduce our transport energy use as a designated shipper under the amended Energy Conservation Act. We are working to reduce per-unit transport energy by switching to large-scale transport and making a modal shift from road to rail and water transport.
In FY2020, as a result of policies to transport goods and raw materials by railway and ship, we achieved a modal shift of approximately 83%, thus maintaining last year's high level, and successfully controlled worsening of per-unit transportation energy caused by a reduction in transportation volume.
* The table is slidable aside.
* Ton-kilometer: Freight Tonnage (ton) x Transport Distance (km)
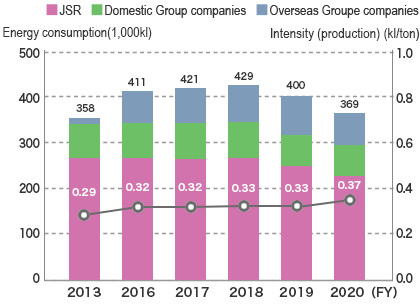
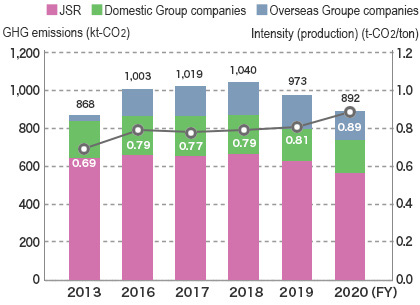
3. JSR Group’s GHG Emissions and Energy Consumption
We also reduced our GHG emissions and energy consumption in FY2020 as a result of lower production volume as well as our various energy conservation activities. (GHG emissions: 8% year-on-year reduction; energy consumption: 8% year-on-year reduction)
As a response to TCFD, we are making approaches toward reducing GHG emissions on a global scale.
GHG emissions
Energy consumption