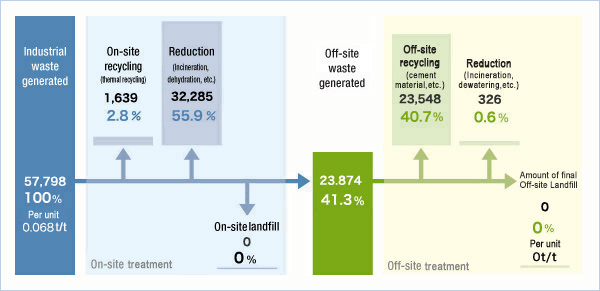
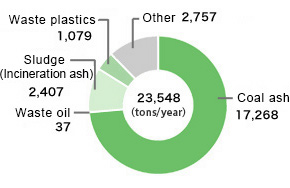
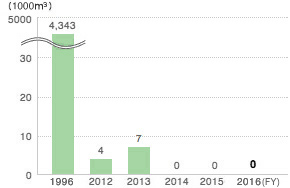
Since FY2001, JSR has been implementing its goal of "zero waste"*1 through activities that include prevention of waste materials, sorting of waste, and the search for recycling locations at all plants. In the period from FY2004 to FY2016, ongoing efforts have enabled us to reach our goals in zero waste activities. About 90% of the total volume of generated waste materials is taken up by surplus sludge resulting from the activated sludge treatment of wastewater and by coal ash generated in the coal boilers used for on-site power generation. With regard to this surplus sludge, sludge drying equipment was introduced at the Yokkaichi Plant in December 2012. This has enabled sludge to be processed into a valuable fuel product. Additionally, coal ash is recycled for use as cement materials. In addition to using waste oils and other materials as fuels, we promote the recycling of bottles, cans, drums, paper, fluorescent lamps, dry cell batteries and organic waste. The final landfill volume in FY2016 was zero. In the future, we will strive to implement ongoing zero waste operations by further continuing our search for recycling locations and our other efforts.
*1 Zero waste: When the volume of final off-site waste buried at third-party landfills is less than 0.1% of the volume of waste generated
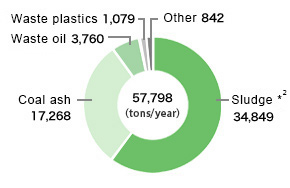
*2 20% of sludge accounted for as solid waste

JSR has always been serious about environmental measures in the distribution and logistics workflow. Therefore, we promote 3R, (Reduce, Reuse, Recycle) to effectively utilize waste-free packaging materials and packaging containers.
Reduce: Reducing the weight of steel box pallets used as packing containers for synthetic rubber and the weight of external cardboard boxes (two-tier construction to single-tier).
Reuse: Preventing the breakage of packaging materials that can be reused as intermediate product containers.
Recycle: Promoting a switchover to recyclable materials when selecting packaging materials. JSR will actively engage in the above 3R activities for packing materials to promote recycling and effective use of resources.
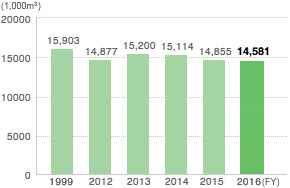
JSR consumed approximately 14,580,000 cubic meters of industrial water, groundwater*3, and tap water in FY2016.
Twenty-nine percent of this volume was recycled effectively for use in various work processes at each plant. Key goals include the implementation of initiatives to improve water resource management and maintain the current level of water recirculation and reuse. The Yokkaichi Plant participates in the Yokkaichi Region Environment Council and continues to reduce water usage through the sharing of information on new water quality regulations.
*3 Groundwater is not used at the Yokkaichi and Chiba Plants.
| FY | 1999 | 2012 | 2013 | 2014 | 2015 | 2016 |
|---|---|---|---|---|---|---|
| Industrial water | 15,196 | 14,319 | 14,671 | 14,733 | 14,359 | 14,190 |
| Ground water | 533 | 402 | 380 | 234 | 357 | 253 |
| Tap water | 174 | 156 | 149 | 147 | 139 | 138 |
| Total Water Consumption | 15,903 | 14,877 | 15,200 | 15,114 | 14,855 | 14,581 |
| Intensity index*4 | 100 | 107 | 99 | 102 | 108 | 108 |
| Usage of recycling water | 0 | 4,144 | 4,377 | 4,496 | 4,249 | 4,159 |
| Effective recycling ratio (%) | 0 | 27.9 | 28.8 | 29.7 | 28.6 | 28.5 |
| Seawater (coolant) | 60,731 | 55,405 | 62,772 | 59,830 | 57,395 | 54,725 |
*4 FY1999 represents the 100 level.
[(fiscal year water consumption)/(annual production volume for the fiscal year)]/[(FY1999 water consumption)/(FY1999 production volume)]x100