The Environment (Initiatives to Prevent Global Warming)
Initiatives Aimed at Preventing Global Warming
Energy Consumption
JSR's Responsible Care Committee adopted a Medium-Term Voluntary Environmental Preservation Plan. This plan sets targets regarding energy intensity for reducing energy use as measures to prevent global warming. To achieve them, JSR is carrying out the E-100 plus project at all of its Group companies to reduce energy and resource consumption. In FY2014, we were able to achieve the energy intensity targets, as we did in FY2013. We will continue to focus on the targets and make further efforts to conserve energy.
Energy Reduction Targets
Reduce energy consumption per unit of production by an average of 1% per annum, using FY1999 as the base year (voluntary standard based on the amended energy conservation law*1)
(The standard has been maintained since FY2013.)
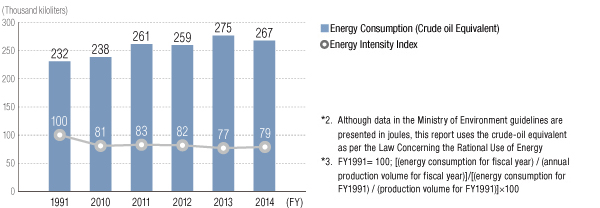
Energy Consumption (Crude oil Equivalent)*2 and Energy Intensity Index*3
Initiatives to Reduce Greenhouse Gases
With increasing moves in recent years by businesses to manage greenhouse gases indirectly emitted from their supply chains (scope 3: production, transportation, business travel, employee commuting, etc.) and disclose their emissions at the global level, JSR has launched initiatives based on the Basic Guidelines on Accounting for Greenhouse Gas Emissions Throughout the Supply Chain issued by Japan’s Ministry of the Environment.
Scope of greenhouse gas emissions from businesses (conceptual illustration)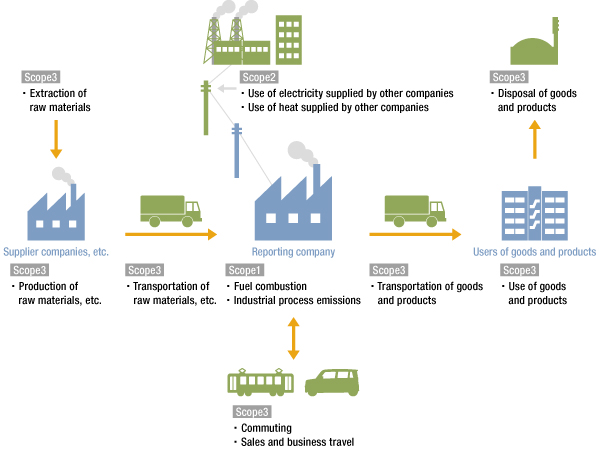
Source: Ministry of the Environment and Ministry of Economy, Trade and Industry, Basic Guidelines on Accounting for Greenhouse Gas Emissions Throughout the Supply Chain Ver. 1.0, Fig. 4-1.
Actions for Scope 1
CO2 emissions
JSR set a CO2 emission reduction target under the Medium-Term Voluntary Environmental Preservation Plan and is striving to meet this target through various energy saving activities.
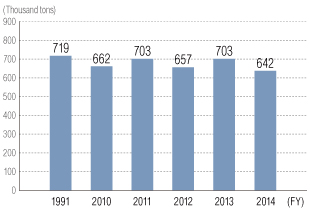
CO2 Emissions Volumes
Establish a system during FY2013 that enables a 6% reduction in total CO2 emissions from the three plants compared to FY1991
(Achieve the 6% reduction target in FY2014.)
In FY2013, JSR was committed to upgrading our energy saving technologies through such measures as fuel switching at the Kashima Plant (Kashima South Joint Power Corporation) and the introduction of a sludge dryer system at the Yokkaichi Plant, and achieved the target of establishing a system “that enables a 6% reduction in total CO2 emissions from the three plants compared to FY1991.” In FY2014, we achieved an approximately 10.7% reduction in CO2 emissions compared to the base year FY1991 through implementation of fuel switching at the Kashima Plant (Kashima South Joint Power Corporation), operations of the sludge dryer system at the Yokkaichi Plant, and other measures.
Examples of measures taken to reduce CO2 emissions| Example 1: Introduction of a natural gas-fired turbine cogeneration system | |
|---|---|
| The Yokkaichi Plant installed a natural gas-fired turbine cogeneration system in April 2010. By using natural gas as fuel, this system helped us to cut CO2 emissions by approximately 32,000 tons in FY2014 compared to emissions using the previous coal and heavy oil-fired steam boiler and condensing steam turbine system. |
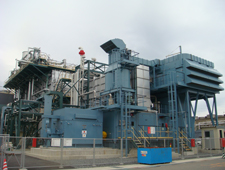 Natural gas-fired turbine cogeneration system (Yokkaichi Plant) Natural gas-fired turbine cogeneration system (Yokkaichi Plant) |
| Example 2: Introduction of a sludge dryer system that makes sludge combustible | |
| The Yokkaichi Plant installed a sludge dryer system to dry sludge generated from the wastewater treatment facilities. Prior to this, sludge with high water content was incinerated using a combustion support fuel (heavy oil) on the plant’s premises. The system is capable of making sludge combustible without the need for any combustible support fuel and is expected to reduce annual CO2 emissions by approx. 15,000 tons. |
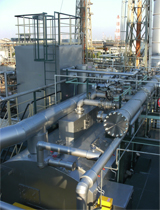 Sludge dryer system (Yokkaichi Plant) Sludge dryer system (Yokkaichi Plant) |
Actions for Scope 2
Measures to Cut Power Consumption at the Head Office Building
The Tokyo Metropolitan Government requires major tenants of a building occupying 5,000 square meters or more in floor area or consuming six million kWh or more of electricity annually to reduce its CO2 emissions under the Tokyo Metropolitan Ordinance on Environmental Preservation.
Although we are not subject to this obligation, we are promoting energy conservation on our own initiative by voluntarily setting a specific power saving target.
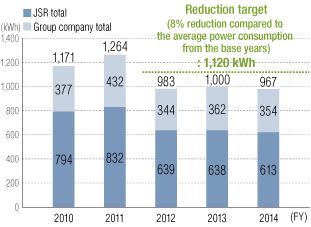
In FY2014, as a result of the efforts specified below, our power consumption decreased by 21% compared to average consumption from the base years.
Power Saving Target for the Head Office Building
An 8% reduction compared to the average power consumption from the base years of FY2010 and FY2011
-
Major Efforts
- Reduced the number of lights and office appliances, such as printers.
- Visualized our power saving situation, and made our employees become more aware of turning off the power for unused machines and rooms.
- Implemented the so-called “Cool Biz.”
- Changed our employees' working schedule to have them begin work and return home earlier than usual on two days per week in July and September.
- Maintained a proper air-conditioned room temperature that achieves a balance between energy savings and operational efficiency.
Actions for Scope 3
Logistics Environmental Policy: Improving Transport Efficiency
As part of our environmental efforts in transportation, we have taken systematic steps to reduce our energy use in transportation as a designated shipper under the FY2007 amended Energy Conservation Law. We are trying to reduce transport energy intensity by at least an average of 1% per annum by using larger tanker trucks and shifting from road to rail and water transport.
In FY2014, we continued to promote a shift from road to rail and water transportation for products and raw materials. However, energy intensity was maintained at the same level as the previous year due to a decline in the percentage of transport by ship caused by a decreased volume of material transportation.
Nonetheless, we were able to reduce transport energy intensity by 6.0% compared to FY2007.
| FY | 2010 | 2011 | 2012 | 2013 | 2014 |
|---|---|---|---|---|---|
| Transport volume (million ton-kilometers*) | 427 | 479 | 473 | 471 | 492 |
| Rail/Sea transport ratio (%) | 85 | 84 | 83 | 82 | 83 |
| Energy consumption level (kiloliters: converted to crude oil) | 7,681 | 8,729 | 8,726 | 8,655 | 9,026 | Energy intensity (kiloliters/1,000 ton-kilometers) | 0.018 | 0.0182 | 0.0184 | 0.0184 | 0.0184 |
| CO2 emission level (tons) | 19,600 | 22,100 | 22,218 | 21,907 | 22,960 |
| ▪Transportation and delivery of raw materials and other materials (tons) | 9,610 | 9,953 | 10,294 | 9,686 | 10,489 |
| ▪Transportation of waste generated in operations (tons) | 298 | 269 | 219 | 175 | 164 |
| ▪Transportation and delivery of products (tons) | 7,784 | 9,182 | 9,363 | 9,502 | 9,842 |
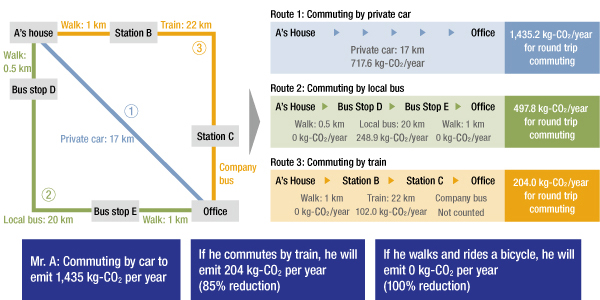
Understanding CO2 emissions from employee commuting
In FY2014, we conducted a trial to estimate the level of CO2 emissions generated from transportation during commuting by employees.
Difference in CO2 emissions based on transportation type